As of January 2024, Everviz no longer offers free accounts for creating data visualizations.
You will not be able to create new visualizations on the free tier, and if you have existing visualizations, you may still embed them, but you will no longer be able to edit them. If you need to edit existing visualizations and/or create new visualizations, please email web-platform@berkeley.edu.
The Data Visualization (formerly Highcharts) widget is sponsored by People & Culture for the Web Accessibility Staff Organization.
Overview
The Data Visualization widget allows you to embed accessible, interactive data visualizations, utilizing a third-party tool called Everviz. Dozens of chart types and variations are available, including line, spline, area, column, bar, pie, scatter, and map-based charts. You can try Everviz without creating an account, create a free account with a limited number of charts for ease of editing and updating, or if needed create a paid account to access advanced features such as teams, custom themes, API access, and webhooks. When using the free tier, your embedded chart will include a "Powered by Everviz" link.
Below is some basic information to get you started. See Everviz documentation for full instructions, and see the main Everviz website to start creating charts/maps.
Accessibility
All the standard Everviz chart types include accessibility support that enables interacting with the chart using the keyboard, a screen reader, or other assistive technology. Custom charts created using advanced features or custom themes may not be accessible. Use the built-in chart types and theme colors for best accessibility.
To help ensure accessibility of your embedded charts, only use one embedded chart per page. If more than one chart is used per page, the "View on Everviz" link text provided by Everviz will not be unique enough (see Give your links unique and descriptive names).
Data sources and restrictions
You can paste data from Excel, Google Sheets, or CSV files into Everviz, or connect directly to a published Google Sheet. UC Berkeley's standard data protection policies apply. Protected data is not allowed.
Configuration options
By default, your embedded chart will include a menu with image export, data viewing, and data download options. One of the options is "Open in Everviz." If a visitor chooses this option, they will not be able to edit your embedded chart or its data. Everviz creates a copy of the chart for them. To remove this menu, go to "Customize" and select "Exporting." Uncheck the "Enable exporting" button. This menu is all-or-nothing; there is no way to allow exporting an image without also allowing data download and opening a copy of the chart.
Everviz visualizations are cached by their server. It is best to make configuration changes before you first publish your chart to ensure that the changes are in effect when you create your widget.
How to add a Data Visualization widget
To add this widget, once you are in "Customize this Page" mode, click on the plus sign (+) to add a widget, and then select "Embeddable Content":

Then, click "Data Visualization":

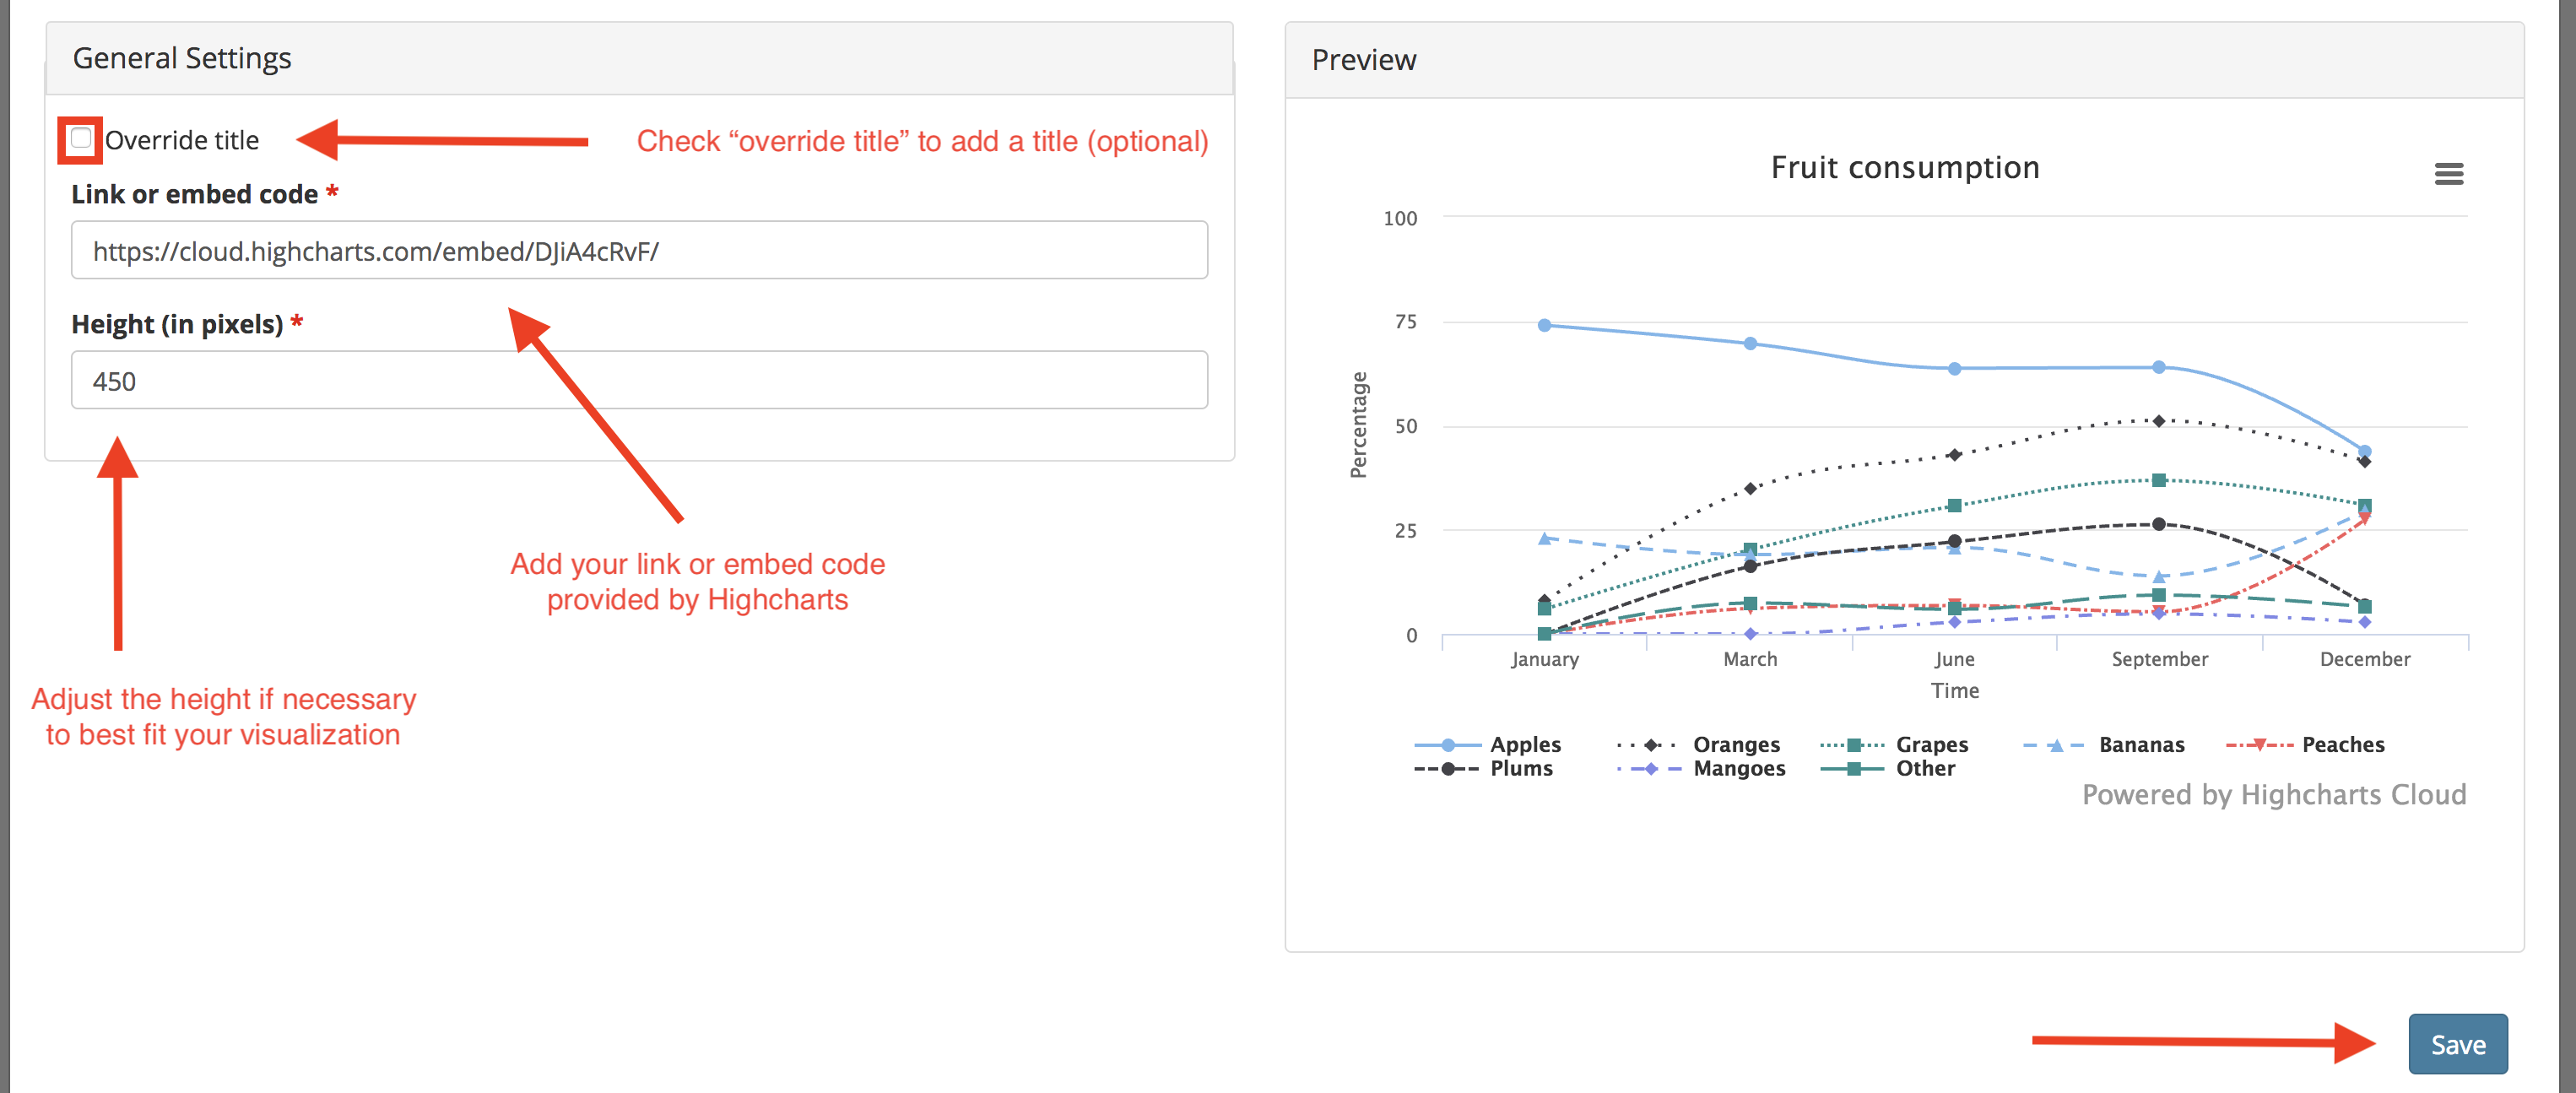
From here, configure the Data Visualization widget. Check "Override Title" to add a new title if desired (optional). Copy and paste the link or embed code (iFrame code or Share URL) provided by Everviz into the "link or embed code" field (required). If necessary, change the pre-filled number in the "Height" field in order to best fit the individual visualization. Click "Save" when you're finished making the changes to the individual widget, then click "Save" at the bottom of the page to complete the process.